White Paper: Optimising X-Ray Diffraction for Challenging Pharmaceutical Sample Types
Cormica provides GMP & GLP accredited analytical chemistry services that help pharmaceutical and medical device manufacturers bring safe, effective products to market. Our capabilities span method development, validation, impurity analysis, extractables and leachables, and stability testing, all delivered with regulatory excellence and scientific expertise.
In the pharmaceutical laboratory, X-ray Diffraction (XRD) analysis is commonly used to test drug substance or drug product in powder form; the factors which must be considered when preparing and presenting this sample type to the instrument are well understood. However, pharmaceutical test samples encompass far more diverse sample types than just powders – there is a need to analyse drug products such as wafers, tablets, suspension and films, for instance. For these sample types, achieving optimal sample presentation can be challenging especially when analysing the sample using reflection geometry, but can be effectively mitigated using transmission geometry. In this case study, we explore the application of Cormica’s Malvern Panalytical Empyrean S3 X-ray diffractometer to overcome the challenges presented by these sample types.
Continue reading below
Authors:

Trusha Harrison-Mistry
Trusha Harrison-Mistry has been with Cormica for over a decade, progressing from placement student to Senior Scientist in the Physical Characterisation team.
Share with your colleagues:
Theory
Firstly, let’s explore the differences between reflection and transmission geometry:
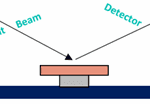
- Reflection Geometry – The standard geometry used, whereby the diffracted X-rays are reflected off the sample surface. This geometry is suitable for analysing samples with a flat, smooth surface, most commonly powder samples. However, reflection geometry can be impacted by preferred orientation of crystallites within the powder which can alter the resulting diffraction pattern.
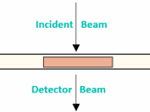
- Transmission Geometry – this geometry involves the X-rays passing through the sample from source to detector. In transmission mode, the sample is typically held in place by two layers of X-ray neutral Kapton® polyimide film, one below the sample and one above. This configuration is highly suitable for analysing thin films, small fragments, suspensions and low-density organic samples, which permit a high level of beam penetration, and it has the additional benefit of minimising the effect of preferred orientation.

Within this case study we will focus on the benefits of using transmission geometry, optimal sample preparations and presentations, and the optimisation of a transmission XRD method in support of best quality data for these atypical sample types.
Study 1 – Pharmaceutical Wafers: Reflection vs Transmission Geometry
Overlay of X-ray Diffraction Patterns Obtained for Wafer Sample: Transmission vs Reflection Geometry
Initial analysis of the wafer samples was carried out via reflection geometry XRD, however this only allowed analysis of a small portion of the surface of the wafer. With the intention of obtaining higher quality data and allowing the analysis of the whole wafer sample, transmission geometry XRD was adopted for this analysis. The mounting of the samples in both geometries is shown above.
Diffraction patterns obtained for wafers analysed using transmission geometry displayed significantly sharper peaks with improved resolution and signal:noise ratio compared with the same samples analysed using reflection geometry. This is due to the more consistent sample presentation, and greater proportion of the sample being tested, when presenting in transmission vs reflection geometry. Additionally, the impact of preferred orientation has been mitigated – exemplified by the change in intensity of the peak at Ca. 9 °2theta, which is exaggerated in the reflection geometry pattern.
Study 2 – Oral Suspensions: To Centrifuge or to Not Centrifuge? That is the question…
One of the benefits of using transmission geometry when analysing suspension samples is that this sample presentation eliminates the risk of the sample being displaced from the sample holder during analysis – as typically XRD samples are rotated during testing. This is because, when prepared for transmission analysis the suspension is held securely between two sheets of Kapton® film within the transmission holder. When using reflection geometry, the risk of sample displacement can be mitigated by concentrating up the sample, for instance by centrifugation, but (a) this is not feasible for all suspensions and (b) there is a potential for this process to change the composition of the sample and influence the data obtained. Hence, depending on the composition of the suspension, centrifugation can either hinder or help the generation of optimal data by XRD. Trials of centrifuging vs not centrifuging were carried out on two different suspensions prior to presenting the sample to the XRD.
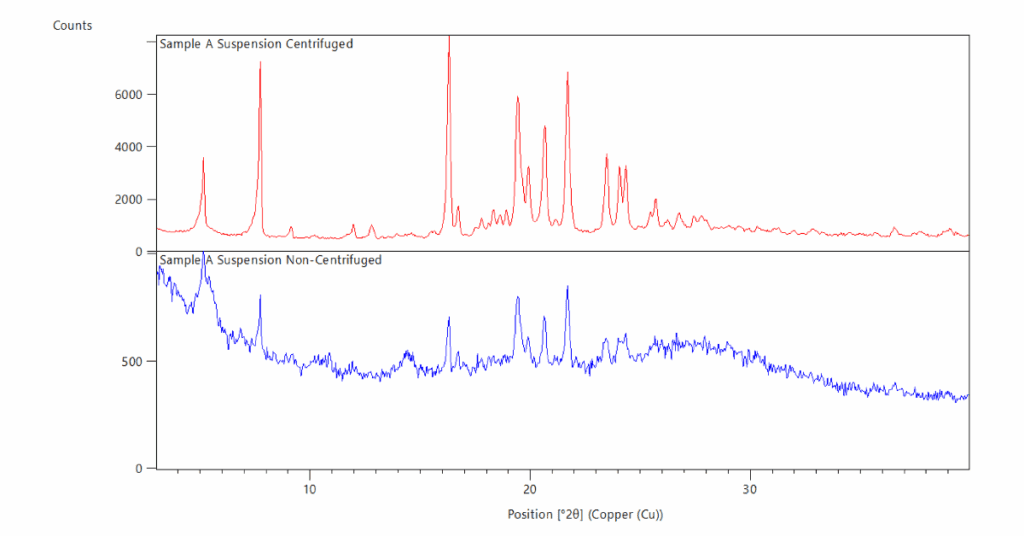
Overlay of X-ray Diffraction Patterns Obtained for Sample A: Centrifuged vs Non-centrifuged Suspension Sample
Sample A was prepared in two ways. Firstly, the sample was directly dispensed into the transmission sample holder and presented to the instrument. Secondly, the sample was centrifuged down, and the resulting supernatant was discarded. The remaining solids were then collected and presented to the instrument within a transmission sample holder.
In this instance, preparing the sample including a centrifugation step provided an XRD pattern which was significantly more intense (Ca. 8000 counts compared to Ca. 1000 counts) with sharp, well-resolved and defined peaks, and vastly improved signal:noise ratio.
However, centrifuging the sample does not always generate this improved response.
Sample B was prepared using the same methodologies as Sample A; however, a different outcome was obtained.
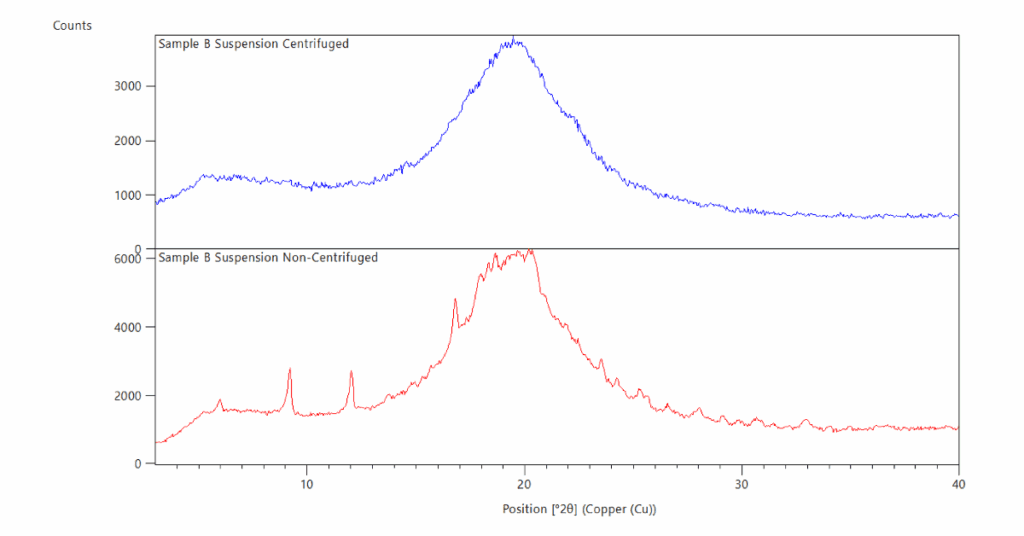
Overlay of X-ray Diffraction Patterns Obtained for Sample B: Centrifuged vs Non-centrifuged Suspension Sample
In this instance the non-centrifuged sample exhibited more defined peaks attributable to the API within the overall amorphous halo, compared to the pattern obtained for the centrifuged sample. This could be attributed to the post-centrifugation sample predominantly consisting of the non-crystalline excipients responsible for the amorphous halo. With the crystalline API concentration reduced to below the limit of detection (visual assessment) when discarding of the supernatant.
These two examples demonstrate that to centrifuge or not to centrifuge is highly sample dependent and is influenced by the composition of the suspension, particularly how the API presents itself within the suspension.
Study 3 – Thin Films: Method Optimisation for an Unusual Sample via Transmission XRD
Initial analysis of the film sample was carried out using reflection geometry, however this was found to present difficulties, including ensuring that the films remained flat and in situ during testing. Despite efforts to remedy this, the data generated was not of sufficiently good quality for its final intended purpose and the films had a tendency to become displaced during sample rotation.
Hence, the use of transmission geometry was trialled, using two layers of Kapton® film to hold the sample film firmly in place, secure and flat, within the sample holder, yielding much improved data.
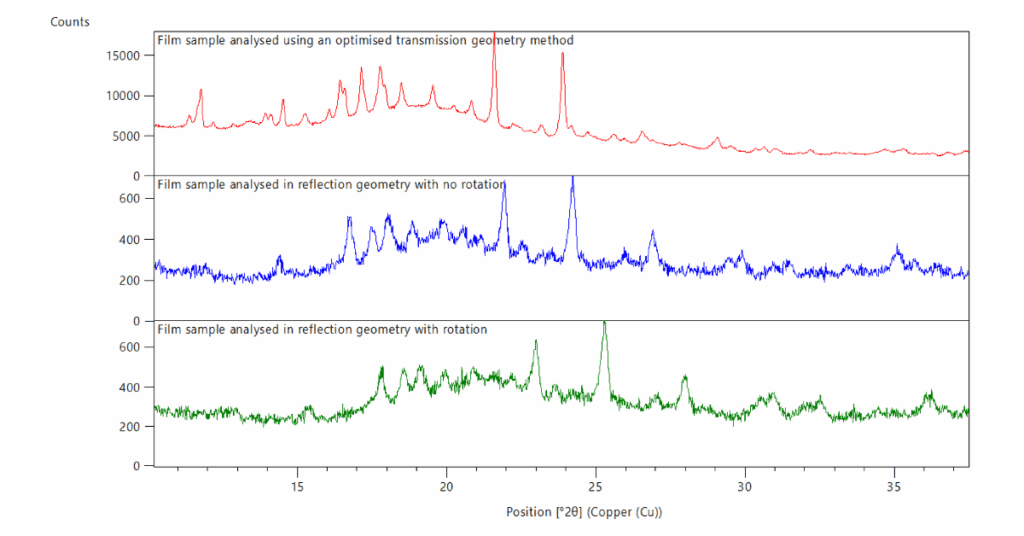
Overlay of X-ray Diffraction Patterns Obtained for Film Samples: Reflection Geometry (with and without rotation) vs Transmission Geometry
The diffraction patterns obtained using reflection geometry had low counts (< 1000 counts) and very noisy data, while switching to transmission geometry yielded significantly higher counts (> 15000 counts) and was far more suitable for its final intended purpose – quantitative phase analysis via Rietveld refinement.
Conclusions
The use of the Empyrean, with its dual geometry and modular sample presentation options, has been invaluable in the analysis of challenging sample types by XRD and highlights the importance of considering the use of transmission geometry over reflection geometry.
The data generated using transmission geometry for both pharmaceutical wafers and film samples was shown to demonstrate enhanced peak sharpness and resolution, with a higher intensity and an improved signal:noise ratio, when compared with the data generated using reflection geometry for the same sample types. Without this, the subsequent quantitative phase analysis would not have been possible.
For suspension-based samples the intrinsic properties of the suspensions, and hence the sample preparation route adopted, was an important consideration in addition to the choice of instrument geometry.
Ultimately, to achieve the best outcome for analysis, a robust understanding of the key parameters influencing data quality is essential. The versatility of the Empyrean XRD, combined with the high level of experience onsite allows Cormica to overcome even the most challenging of diffraction assessments.